Good Feeds Us All
Our heart for the planet and people guides our approach to every ounce of food we make.

Planet
Thoughtfully tapping into our planet
Simply put, we’re only able to make delicious food if we have a healthy planet to make it on. So it’s critical we work to reduce our consumption of natural resources and inspire others to do the same.

Society
Aiming to be a kind, human company
How we treat people matters. That’s why community is woven through our company’s mission. From empowering our team to supporting those in need, we’re eager to lead by example.


Stories
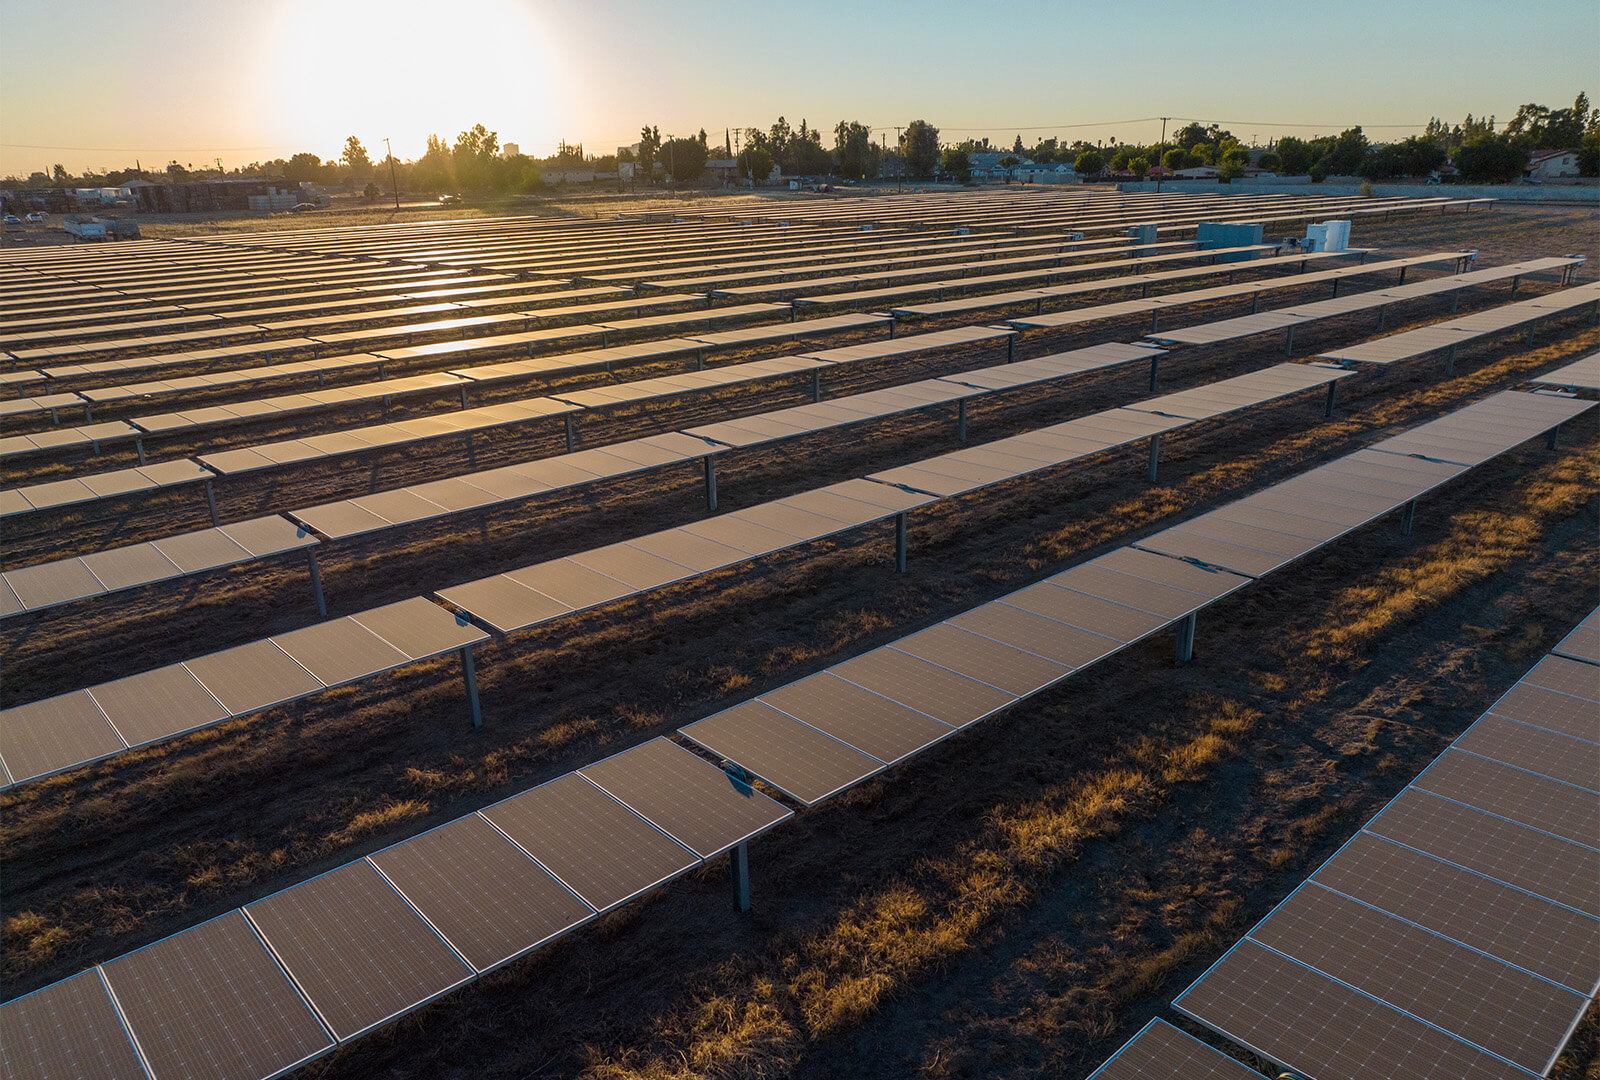
Sun-Powered Snacking
Processing 100,000 pounds of grain a day takes a lot of energy, and this plant gets it from the sun
Learn More